New global map shows populations are growing faster in flood-prone areas
Even as climate change and urbanization make floods more frequent and their consequences more severe, a higher proportion of people are living in areas that experience them.
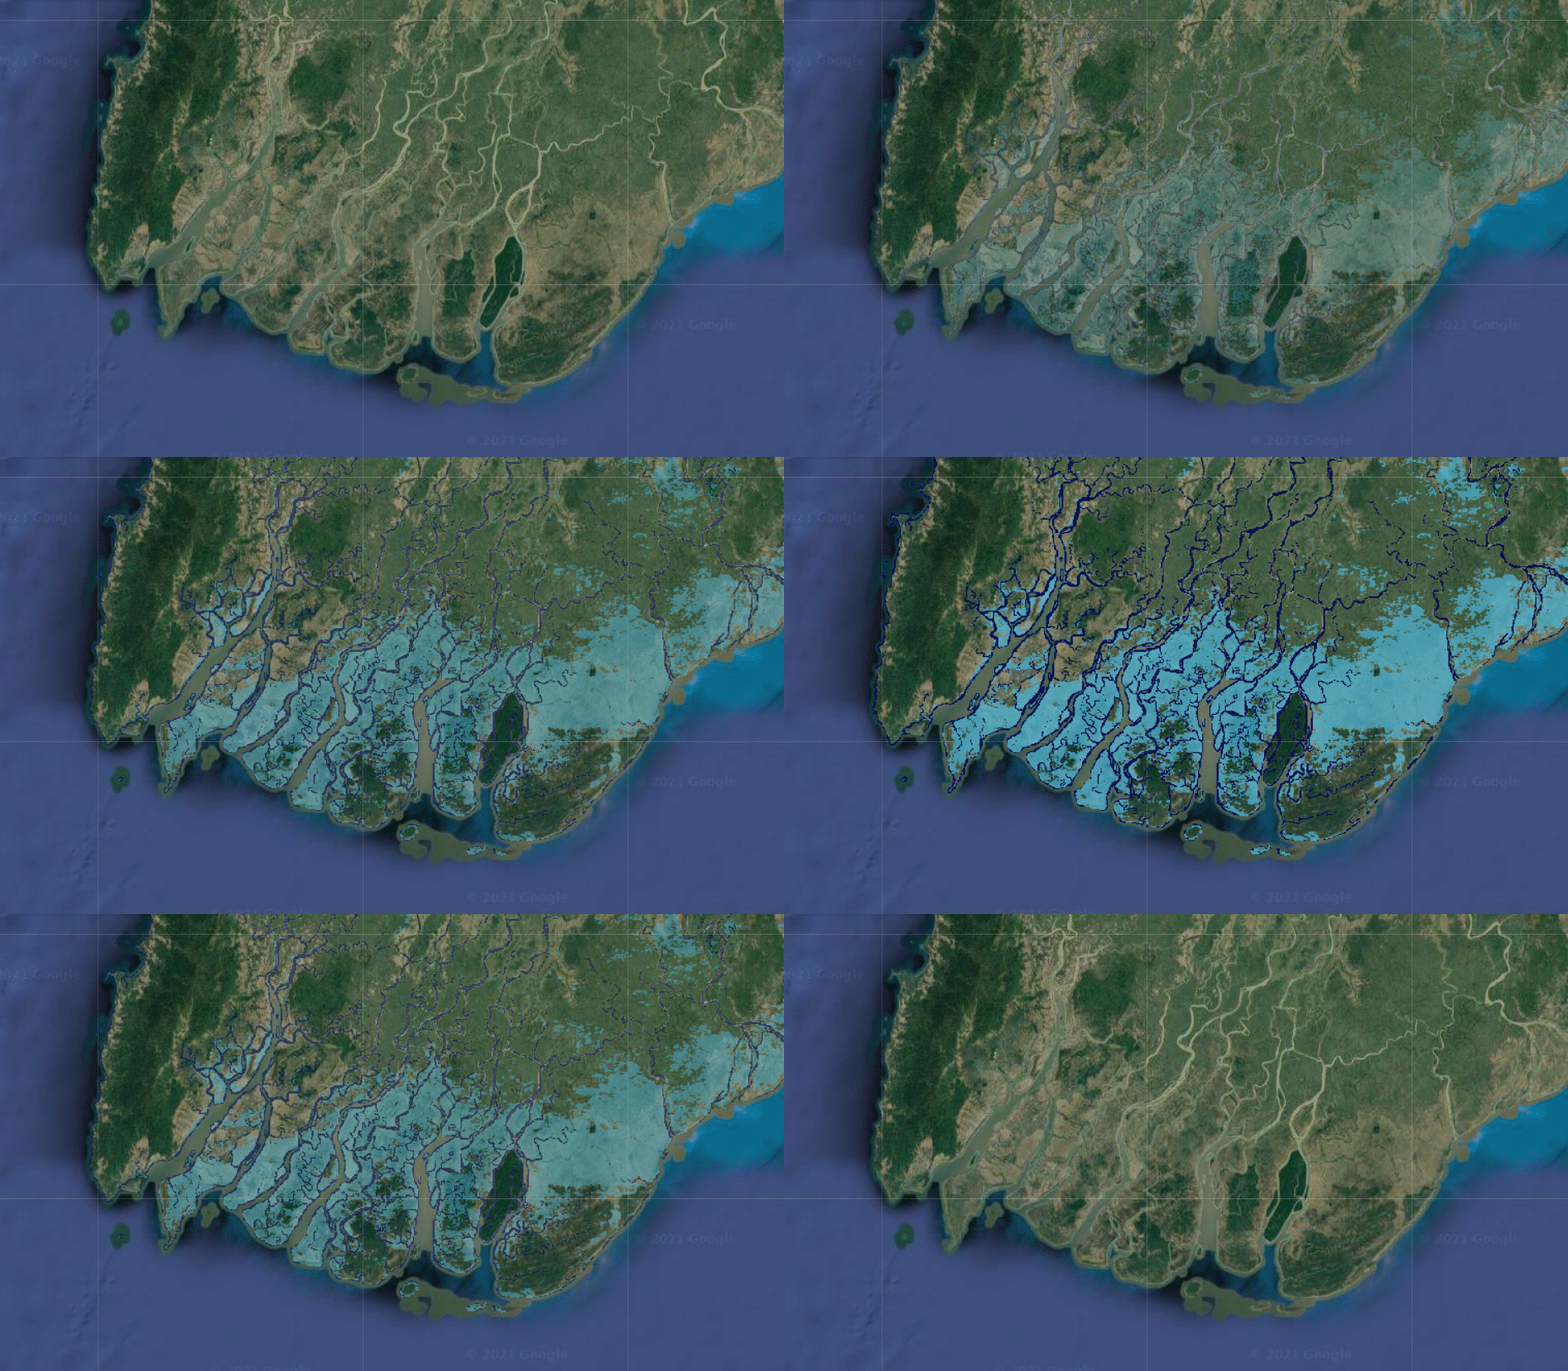
In a new study published today in Nature, researchers used satellite images to map over 900 flood events that occurred between 2000 and 2018, affecting between 255 million and 290 million people.
And while the global population grew by 18.6% from 2000 to 2015, the population in these areas outpaced that growth, increasing by 34.1% over the same period. That means between 58 million and 86 million more people were exposed to flooding in those places over the course of 15 years.
“It’s not particularly surprising that floods would increase,” says Beth Tellman, cofounder of the flood-mapping startup Cloud to Street and the lead author of the study. “But what was striking to me was that people were moving into places where we’ve observed flooding in the past.”
The researchers looked at over 3,000 events in the Dartmouth Flood Observatory database, which logs floods reported in media coverage. They matched events that had location data to satellite images from MODIS, an instrument mounted on two NASA satellites that have each captured daily images of Earth since 2000.
The researchers used an algorithm to map where flooding had occurred by sorting out which pixels were covered with water and which weren’t. Then they added population data to see how trends in flooded areas changed over time.
Low- and middle-income countries saw the fastest population growth in flood-prone areas in the past two decades, with the highest growth rates in sub-Saharan Africa and South Asia.
Socioeconomic factors might explain some of the movement, Tellman says. Vulnerable groups might have no choice but to settle in flood zones, where land might be cheaper and more available.
By using satellite images, the researchers were able to describe the impacts of real floods more accurately than traditional models. Models can capture some types of floods, such as those that occur around rivers and on coasts. But for others caused by heavy rainfall or random events—like dams breaking, or a storm surge lining up with high tide—satellite images provide a clearer picture.

The 913 mapped floods are still only a fraction of the tens of thousands that happen globally each year. “It’s just the tip of the iceberg,” Tellman says.
MODIS takes images with a 250-meter resolution, about the length of two football fields. That means researchers couldn’t map smaller floods or those in most cities. Clouds also interfered with the image-processing algorithm, and since the satellites passed over a specific spot on Earth only once or twice each day, they missed short-term floods as well.
Newer instruments have much higher resolution and can see through clouds, says Bessie Schwarz, cofounder and CEO of Cloud to Street. These tools, along with artificial intelligence, can map floods even more accurately today. But to systematically map floods over time, the researchers had to stick with images from one source, using technology that’s been around for longer.
The effort gives scientists a clearer picture than any other resource of the scale and human impact of recent floods. And the results will be especially useful for modelers trying to predict risk, says Philip Ward, who studies flood risk assessment at Vrije Universiteit Amsterdam and wasn’t involved in the study.
Usually, when researchers build a model to predict flood risk, they test it using maps of past floods. While many floods are mapped by local researchers or governments, they often use different methods, and some data isn’t publicly available. Having a large data set that uses the same method to map many floods will allow researchers to develop more accurate models. “Now you’re comparing apples to apples,” Ward says. “This is really valuable.”
Thinking ahead
Getting a more accurate picture of global flood risk might help steer funding for climate adaptation to the places that need it most, Tellman says. She points to the Central African Republic, a country that is seeing major increases in flood exposure, according to this study, but doesn’t receive much climate adaptation funding from foreign governments and international organizations.
Flood risk reflects a few factors: hazard, exposure, and vulnerability, says Brenden Jongman, a disaster risk management specialist at the World Bank and one of the study’s reviewers. While some flooding is inevitable, governments can address some risk factors to help reduce harm.
Some measures may reduce exposure: moving people out of flood-prone areas by changing zoning laws, or finding new places for them to settle. Others can reduce vulnerability: building more flood-resistant buildings, or putting early-warning systems in place.
And while more people are living in areas that flood, Jongman says some research suggests that vulnerability is actually going down as people adapt to flooding and build more resilient systems.
“The best way to respond to a flood actually comes weeks, months, and sometimes even years ahead of that flood,” says Schwarz. “We have to invest in preparation.”
